Trading Performance Analytics: How to Turn Journal Entries Into Actionable Insights
Learn how trading performance analytics can turn raw journal entries into clear, actionable insights that improve your process and review workflow.
Trading Performance Analytics: How to Turn Journal Entries Into Actionable Insights
Most traders start a journal because they have heard it is the "right thing to do." They log a few trades, write down a sentence or two, and then close the notebook. A few weeks later, when results are mixed, they open the journal again and stare at a wall of unstructured notes. Nothing connects. Nothing jumps out. The journal becomes a record of what happened, but it never becomes a tool that changes what happens next.
That gap between logging and learning is exactly where trading performance analytics come in. Analytics are what transform a stack of journal entries into a feedback loop you can actually use during your weekly review. When you pair a structured journal with the right performance metrics, you stop guessing about your trading and start making decisions based on patterns you can see.
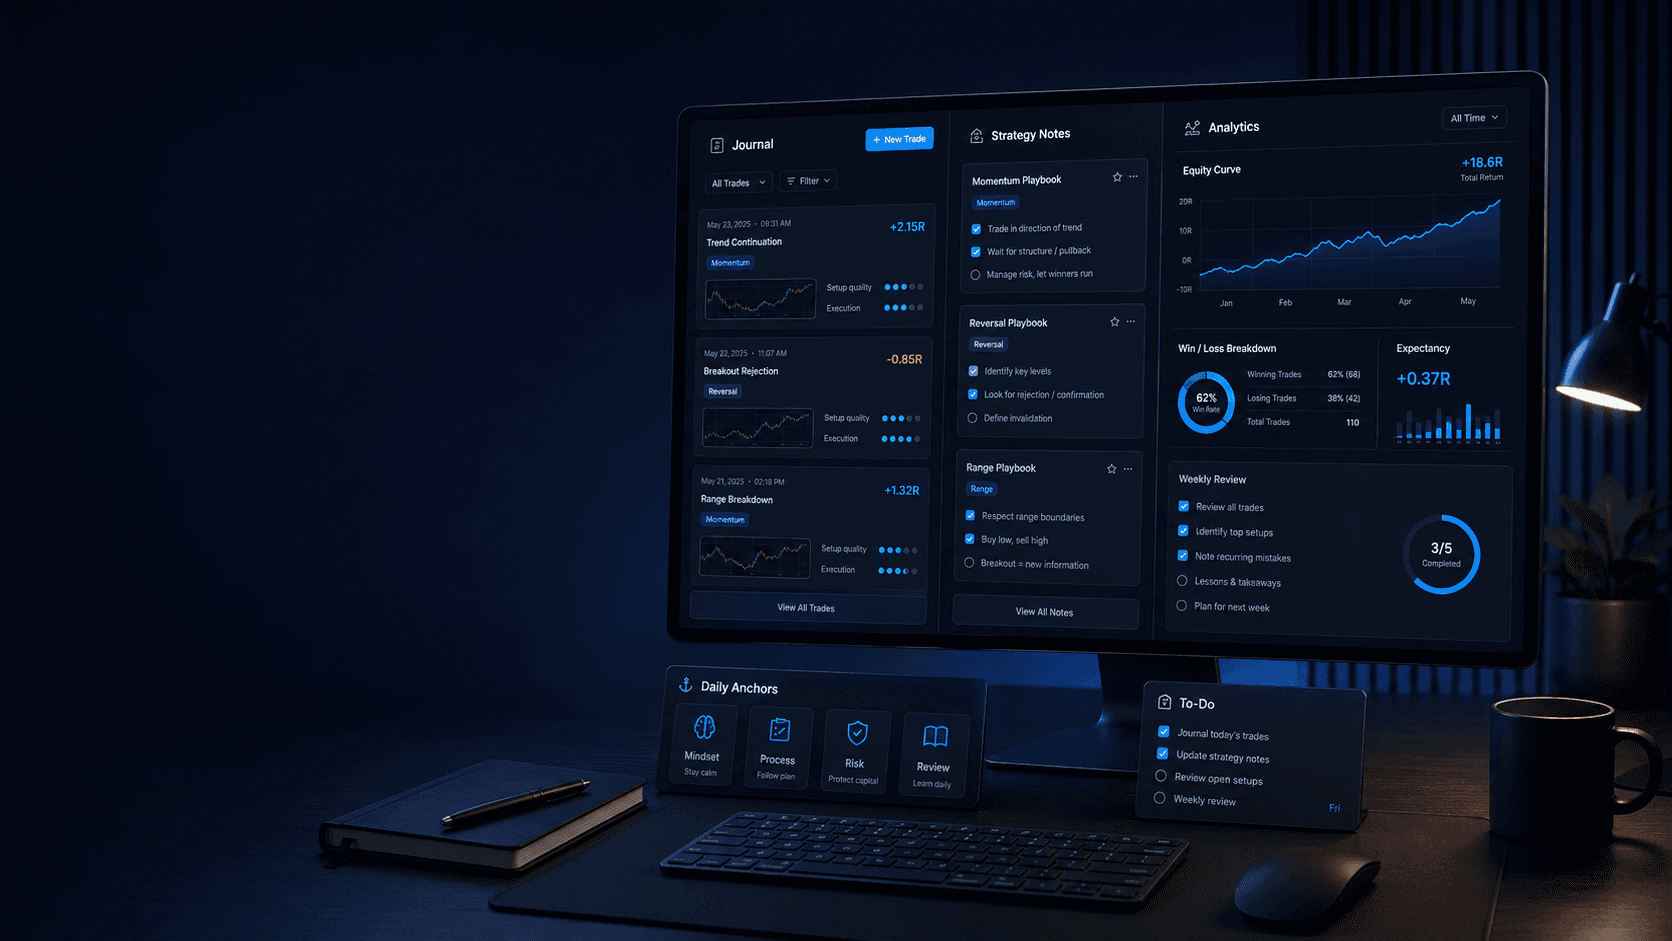
This guide walks through how to build that loop using Reflectrade as your journaling and analytics workspace. It is written for traders who care about process, want a practical workflow, and prefer clear evidence over hype.
Why Logging Alone Is Not Enough
A raw journal entry is just a snapshot. It tells you what you did on one trade, in one moment, under one emotional state. That is useful, but it is not enough to drive improvement on its own.
To improve, you need to compare entries against each other. Which setups actually performed well? Which sessions produced the worst decisions? Was your behavior different on days you followed your plan versus days you did not? Those questions are answered by aggregating entries over time, not by reading them one at a time.
This is where many traders get stuck. They have the data, but they do not have a structured way to analyze it. Spreadsheets can work, but they require manual setup and discipline. A dedicated workspace like Reflectrade is designed to keep entries, screenshots, and performance views in one place so the analysis step is not a separate chore.
What Trading Performance Analytics Actually Means
Trading performance analytics is the practice of turning structured trade data into measurements that describe how you trade. The goal is not to produce a pretty dashboard. The goal is to surface patterns that inform better decisions.
Good analytics usually include a mix of:
- Outcome metrics that describe results, such as win rate, average win versus average loss, and expectancy.
- Process metrics that describe behavior, such as plan adherence, average risk per trade, and frequency of rule breaks.
- Context metrics that describe conditions, such as session, instrument, strategy tag, or market regime notes.
You do not need every metric under the sun. You need a small, consistent set that you actually review. Reflectrade's performance analytics view is built around this idea: keep the core measurements visible so they can guide your weekly review instead of getting buried in noise.
Step 1: Capture the Right Data at the Trade Level
Analytics are only as good as the data you feed them. If your journal entries are vague, your analytics will be vague too. The first step is to standardize what you record on every trade.
At a minimum, each trade entry should include:
- Instrument and direction.
- Strategy tag or setup name.
- Entry reason in one or two sentences.
- Risk defined before entry, in concrete terms.
- Result and any notes about execution.
Reflectrade supports this by letting you tag trades with strategies and attach trade screenshots. Screenshots are especially valuable because they preserve the chart context that words often miss. A picture of the setup at entry, paired with a short note about your reasoning, gives you something concrete to review later. When you look back at a losing streak, you can see whether the setups were actually the same or whether they only felt the same in the moment.
Step 2: Layer in Daily Anchors and Todos
Trades do not happen in a vacuum. They happen inside a day, with a certain energy level, a certain sleep quality, and a certain to-do list. Daily anchors and todos in Reflectrade let you capture that context without turning the journal into a therapy session.
A simple daily anchor might answer three questions:
- What is my main objective for today's session?
- What is my maximum risk budget?
- What is my exit condition if the day goes sideways?
Todos then break that objective into small, trackable actions. Did you complete your pre-market routine? Did you review yesterday's trades before placing new ones? Did you stop trading after hitting your daily loss limit?
When you connect these daily fields to your trade entries, your analytics start to reveal more than just outcomes. You can begin to see whether your process metrics improve on days when you actually complete your anchors and todos. That is a much more actionable signal than a raw win rate.
Step 3: Build a Weekly Review That Uses the Analytics
A journal without a review is just a diary. The review is where the learning happens, and analytics are what make the review efficient.
Set aside a fixed block each week, ideally on a weekend or a low-trading day, and work through a short, repeatable review:
- Pull up your performance analytics view. Look at outcome metrics first. Note any large changes in expectancy, drawdown, or win rate compared to the prior week.
- Cross-reference with strategy tags. Which strategies contributed most to gains and losses? Are there any setups that consistently underperform and should be paused or refined?
- Check process metrics. Did you stick to your risk budget? How many trades broke your rules? This is where daily anchors and todos start to matter.
- Review screenshots and notes. Pick two or three trades that stand out, one good and one bad, and read the actual entries. Look for patterns in how you described your reasoning.
- Write a short summary. Capture the one or two changes you want to test next week. Keep it specific and behavioral, not aspirational.
This kind of review turns analytics into action. It also keeps the loop tight, so the journal stays a living tool instead of a historical archive.
Step 4: Separate Performance From Psychology, Then Connect Them
Trading psychology resources often talk about tracking emotions, and performance analytics often ignore them entirely. The more useful approach is somewhere in between: capture enough emotional context to be honest with yourself, but do not let it become the whole story.
A practical way to do this is to add a short emotional note to trades where behavior clearly deviated from plan. For trades that followed the process, a simple "as planned" tag is enough. For trades where you felt anxious, revengeful, bored, or overly confident, write one sentence about what you felt and what triggered it.
Over time, you can filter your analytics by these notes and see whether certain emotional states cluster around losses or rule breaks. That is far more useful than a generic mood scale. It also respects the fact that most trading problems are not solved by adding more feelings to the journal, but by changing the behavior that those feelings produce.
Step 5: Use Strategies as the Center of Your Review
Strategies are the natural grouping for performance analytics. Most traders run more than one setup, and the only way to know which ones deserve more attention is to measure them separately.
In Reflectrade, you can tag trades by strategy and then look at how each one performs on its own. A setup with a lower win rate but a higher average win might be worth keeping. A setup with a high win rate but a poor reward-to-risk ratio might be quietly draining your account. Without strategy-level analytics, those differences stay invisible.
When you review strategies weekly, ask three questions:
- Is this strategy meeting its expected metrics over a meaningful sample size?
- Are my entries matching the rules of the strategy, or am I drifting?
- Is the current market environment even appropriate for this setup right now?
If a strategy is consistently missing its numbers, the answer is rarely "try harder." Usually it is either that the strategy no longer fits the market, or that your execution has drifted from the original rules. Analytics make that distinction visible.
Step 6: Make the Workspace Fit You, Not the Other Way Around
One of the quiet advantages of a purpose-built workspace is that you can shape it to your workflow instead of bending your workflow around a generic template. Reflectrade's user settings let you adjust how you capture data, which fields matter most, and how your review views are organized.
That matters because analytics are personal. A scalper cares about different metrics than a swing trader. A futures trader during a prop firm challenge cares about different daily limits than someone trading a personal account. The right setup is the one that makes your most important questions easy to answer every week.
If you are starting from scratch and want a workspace that combines journaling, screenshots, daily anchors, todos, strategies, and performance analytics in one place, you can start a free trading journal and build the workflow as you go.
A Simple Weekly Workflow You Can Copy
To make this concrete, here is a workflow you can run with very little setup:
- Before the session: Write a daily anchor with your objective, risk budget, and exit condition. Add two or three todos tied to your routine.
- During the session: Log each trade with instrument, strategy tag, risk, and a short note. Attach a screenshot at entry or exit when it adds context.
- After the session: Mark which todos you completed. Add a one-line summary of how the day felt relative to plan.
- Once per week: Open the performance analytics view, review outcome and process metrics, filter by strategy, and read two or three standout trades. Write a short summary of what to adjust next week.
Run that loop for a month and the journal stops being a record of the past. It becomes the system that shapes the next month of trading.
The Honest Limits of Performance Analytics
It is worth saying clearly: analytics describe what happened, not what will happen. They do not predict the next trade, and they do not remove risk. They are a way to make your decisions more visible so you can adjust your process with intention instead of guesswork.
If you treat analytics as a scoreboard, you will optimize for the wrong things. If you treat them as a feedback loop, they become one of the most useful tools in your trading workflow. The difference is in how you use them.
Final Thoughts
Trading performance analytics are not about collecting more numbers. They are about building a tighter loop between what you plan, what you do, and what you learn. A journal that captures the right data, a workspace that keeps it organized, and a weekly review that actually uses the analytics together form a system that compounds over time.
Reflectrade is built to support that system. It gives traders a single place to log trades, store screenshots, set daily anchors, manage todos, organize strategies, and review performance without bouncing between tools. If that sounds like the kind of workflow you want to build, you can start a free trading journal and shape it to fit how you actually trade.
Disclaimer
Reflectrade is a journaling and analytics tool, not financial advice. Trading involves risk, and past performance does not guarantee future results. This article is educational and informational only and is not investment advice.